What’s the Fed Thinking
The Fed decides on rates today, with odds as recently as yesterday favoring a 50 basis point cut.
I have little doubt they will cut. But I find it hard to see why when you look at the economic stats.
The latest GDP figures show the U.S. economy grew at 3.3% through June.

The Atlanta Fed’s GDPNow forecast projects that growth will continue at 3% for the current quarter.
And the index of leading economic indicators suggests the economy has more room to run to the upside.

Perhaps they see that yields crossed a line that historically spells trouble for the economy and markets.
Oil and copper prices have also fallen in recent months. And flagging Chinese growth creates a drag on global growth.
So, the Fed could be getting ahead of the curve with a rate cut—though they will never admit it.
But it’s not just cutting in the face of a strong economy that has me scratching my head.
Stock market valuations are extremely rich by most any measure.
And I have the charts to prove it.
The Price of Profits
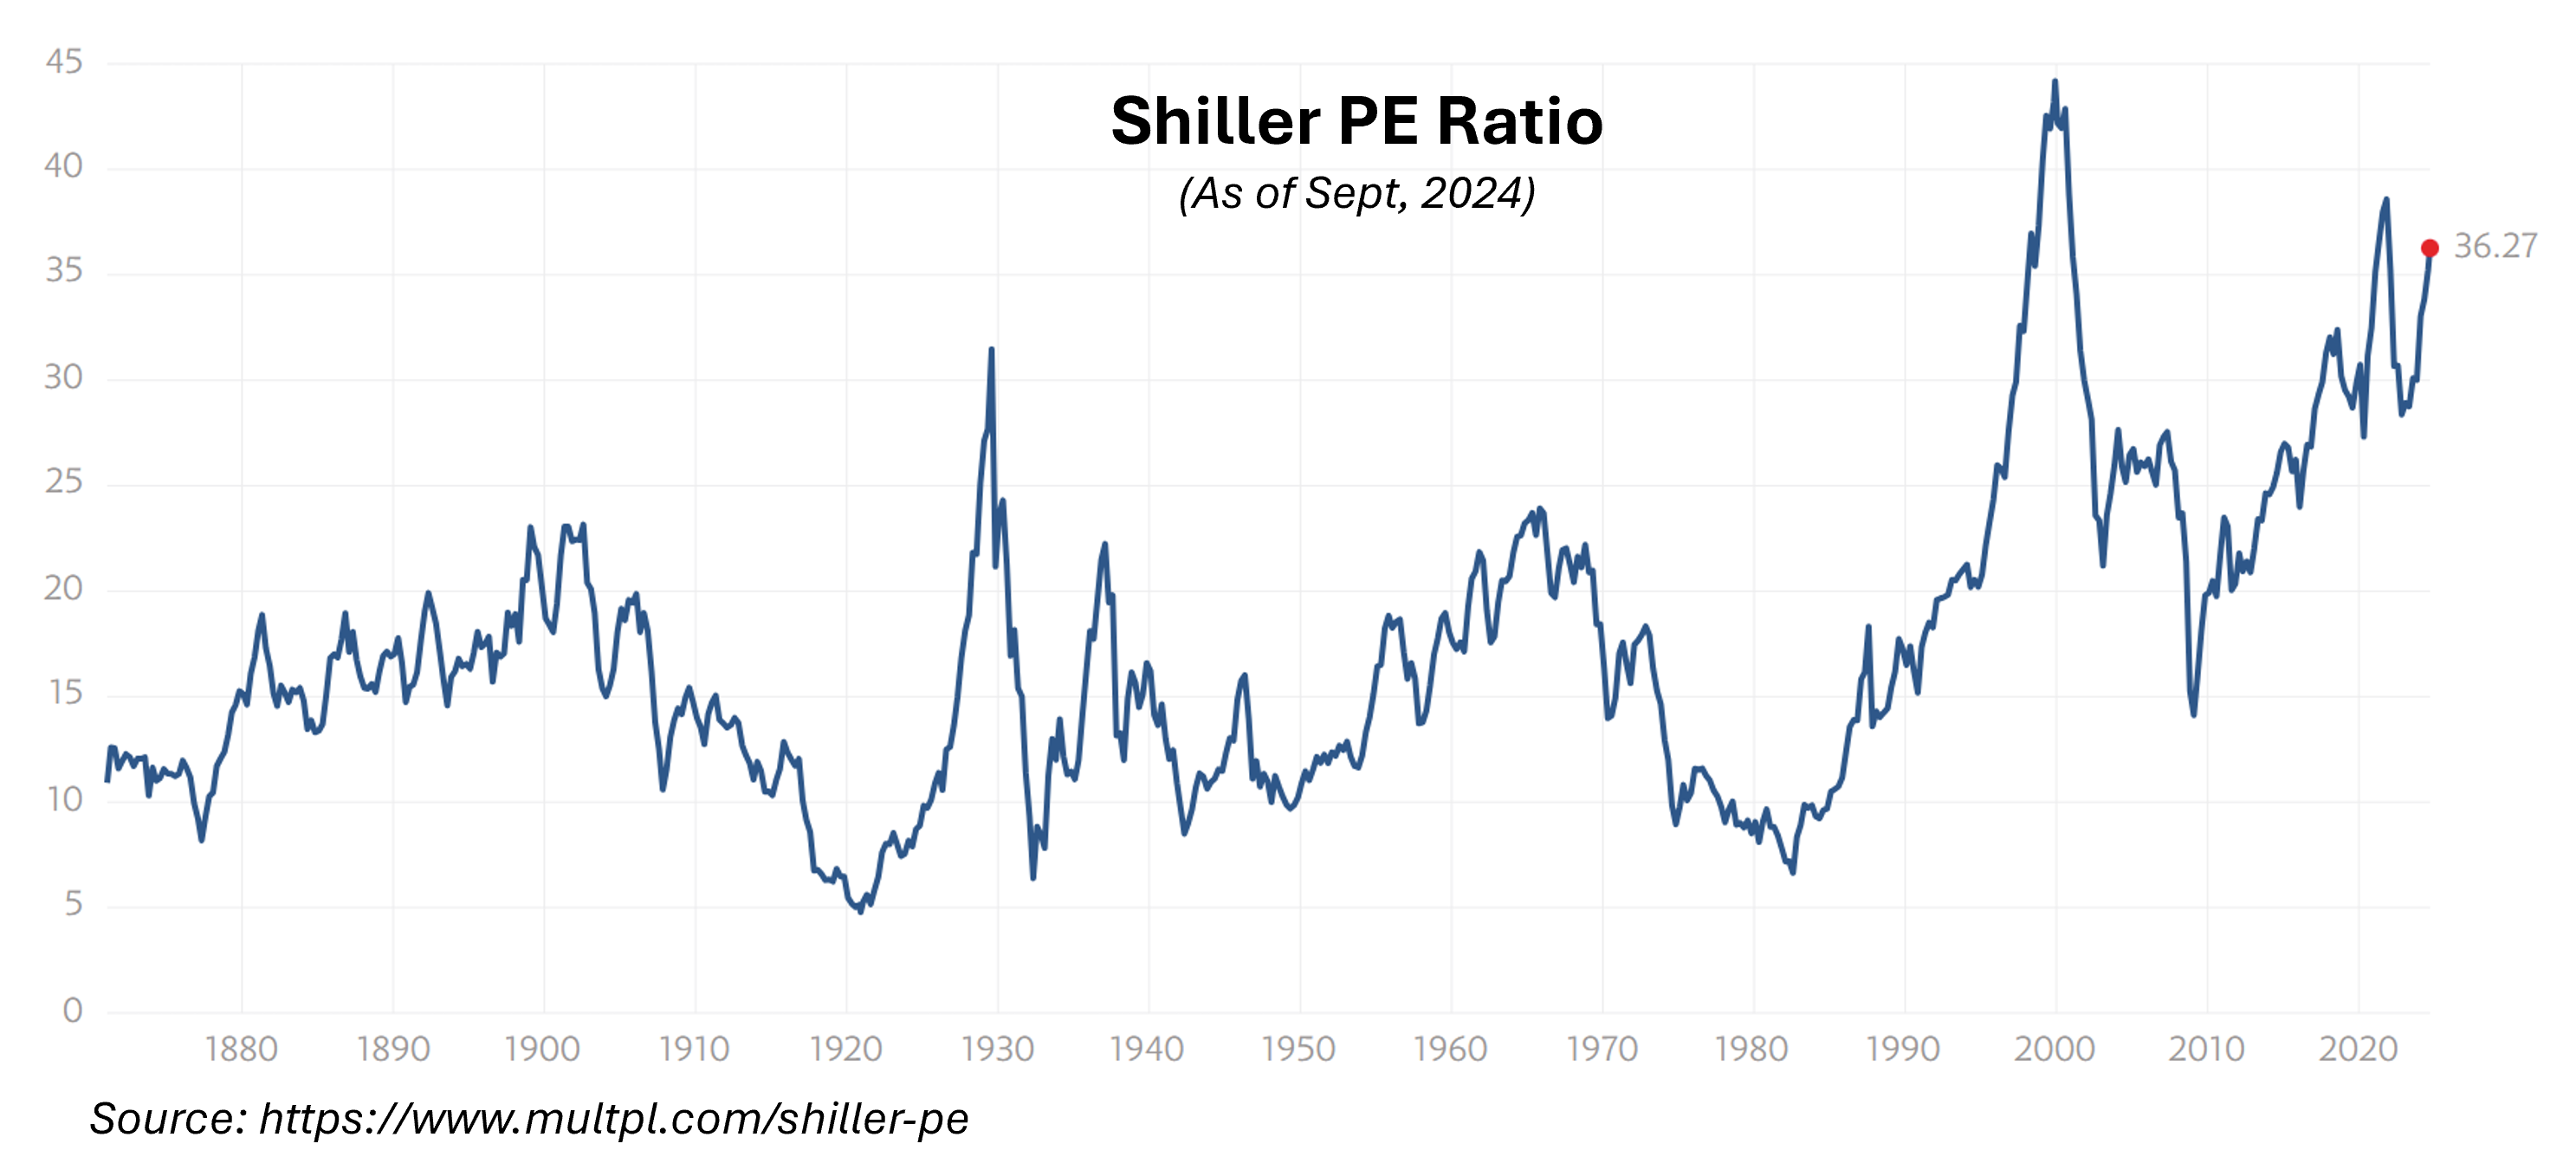
Just as the Dot Com Bubble burst in 2000, Robert Shiller published a book titled Irrational Exuberance to describe the extreme profitability growth markets were pricing into stocks.
In the book, he adjusted the traditional price-to-earnings ratio (PE Ratio) to account for the long-run effects of inflation and traced that metric back over 100 years.
That bubble, or the highest peak in the chart above, was the most extreme overvaluation the S&P 500 had reached in its history.
We’re not quite at that level today. But, at a ratio of 36.27, we’re at a level that the S&P 500 has only twice exceeded since 1871.
You can also gauge market over-valuation by the degree to which current stock prices rely on future competitive profit growth.
Nearly 48% of the S&P’s current 5,625 price depends on future growth. Again, this is a level not seen since the Dot Com Bubble burst.
Unfortunately, S&P 500 profits have not grown for nearly two years. Competitive profits turned negative (red arrow below) in November 2022, when the Fed’s rate hikes began to take a bite.
Yet the profit growth required to justify the S&P’s current price (chart on the right) is just a hair’s breath (0.02 percentage points) from the extreme valuation of the Dot Com Bubble peak.
Below, I compare the spread between the two.
Another way to look at over-valuation is to compare S&P 500 company profits (competitive profits) and their market value to the capital invested in the companies.
While the profit spread to capital (red line below) has declined, the market value spread to capital has charged higher.
Now, I know markets can stay irrational longer than you can stay solvent. This isn’t a call to sell all your stocks and short the market.
But it is a call for caution.
The markets have priced in rate cuts, so don’t expect a big pop tomorrow. Paradoxically, cuts could also signal markets that trouble brews below the economy’s surface.
And be ready to buy great stocks with high potential for competitive profits when the market gives you a chance to buy them on the cheap.
Think Free. Be Free.
Don Yocham, CFA
Managing Editor of The Capital List
Related ARTICLES:
AI Eating Itself
By Don Yocham
Posted: December 20, 2024

How To Keep This Market Moving
By Don Yocham
Posted: December 11, 2024
Crushing the Competition
By Don Yocham
Posted: December 3, 2024

Nvidia: The Only Game in Town
By Don Yocham
Posted: December 3, 2024

The Pilgrims Guide to Voluntary Slavery
By Don Yocham
Posted: November 27, 2024
Who Pays for Trade
By Don Yocham
Posted: November 8, 2024

Capital Won the Election
By Don Yocham
Posted: November 7, 2024

A New Game Just Like the Old Game
By Don Yocham
Posted: October 20, 2024
The Cost of the Dollar Status Quo
By Don Yocham
Posted: October 15, 2024

Capital Components
By Don Yocham
Posted: September 25, 2024
FREE Newsletters:
"*" indicates required fields


